
Solving for Shortages in Newfoundland & Labrador: Employer Experiences and the Labour Market Across Atlantic Provinces
Series | Atlantic Revitalization Employer ConsultationsIntroduction
Most industrialized countries are experiencing worker shortages and skill gaps due to low birthrates, aging populations, and new technologies that require workers with new skill sets. A global survey of nearly 40,000 employers in 43 countries and territories found 45 percent of employers reported having skill shortages (Manpower Group, 2019).
Canada is experiencing these issues, and the Atlantic provinces are facing an even more serious situation. Current trends show a decline in the natural population with more deaths than births being recorded, and with the growing number of retiring baby boomers, the workforce in Atlantic Canada is likely to shrink. From 2012 to 2018 the labour force shrank by 54,400 (Statistics Canada, 2019a). Additionally, the proportion of aging population is higher in Atlantic Canada compared to the rest of the country. In 2018, those aged 65 and above comprised 20.5 percent of Atlantic Canadians (Statistics Canada, 2019a). This age group is forecasted to increase to 30.9 percent by 2035, along with a projected 5 percent overall decline in the total population in the region (Kareem & Goucher, 2017).
There are two major types of labour and skill shortages in the market: cyclical and structural. Cyclical labour and skill shortages can be alleviated by increasing wages, initiating recruitment campaigns, and implementing innovative workplace practices (Skills Canada B.C., 2004). However, structural labour and skill shortages can be difficult to solve in the short run due to a shortage of potential workers with the required quality of skills, driven by demographic and technological changes (Fang, 2009).
What Affects Skills & Labour Shortages in Newfoundland and Labrador?
Demographic, economic, technological and public policy factors have a direct effect on shortages of skilled workers in Newfoundland and Labrador (NL). Specifics on each of these factors are provided in Table 1 below.
Demographics
While Canada’s population has grown in the last decade, NL has been the only province with a shrinking population due to the aging population, declining fertility rates, and out-migration — as shown in Table 1. It also had the lowest percentage of international immigrants in the total population. The province also had the highest median age and the highest proportion of residents who were 65 and older.
Table 1. Demographic characteristics of Canada and the Atlantic Provinces (Statistics Canada, 2016a; 2018a; 2019a)
| Canada | Newfoundland & Labrador | New Brunswick | Nova Scotia | Prince Edward Island | |
| Population, 2018 | 37,057,765 | 525,604 | 770,921 | 959,500 | 153,584 |
| Population change, 2017-2018 (%) | 1.34 | -0.52 | 0.54 | 0.95 | 2.04 |
| Net interprovincial migration, 2017-2018 | N/A | -2,733 | 481 | 3,048 | 177 |
| International migration, 2018 | 303,257 | 1,275 | 4,113 | 5,137 | 2,012 |
| Percentage of immigrants in the population (%)(2016) | 21.9 | 2.4 | 4.6 | 6.1 | 6.4% |
| Median age 2018 (years) | 40.8 | 46.5 | 45.9 | 45.1 | 43.5 |
| Age 0-14 (%) | 16.1% | 13.9% | 14.4% | 14.1% | 15.5% |
| Age 15-64 (%) | 66.8% | 60.8% | 64.8% | 65.5% | 64.7% |
| Age 65+ (%) | 17.1% | 25.3% | 20.8% | 20.4% | 19.8% |
A shrinking and aging population makes labour and skill shortages the most serious in NL compared to the other Atlantic Provinces. From 2014 to 2018 the labour force shrank by 14,835 or 4.4 percent. Moreover, there will be nearly another 35,000 more people exiting the labour market by year 2028, which represents approximately 10 percent of the total labour force.
Table 2. Demographic characteristics of Newfoundland and Labrador (Statistics Canada, 2019a)
| Age group | 2014 | 2015 | 2016 | 2017 | 2018 |
| All ages | 528,159 | 528,117 | 529,426 | 528,356 | 525,604 |
| 5 to 14 years | 52,124 | 52,005 | 51,993 | 51,412 | 50,687 |
| 15 to 54 years | 275,246 | 271,857 | 268,806 | 264,543 | 259,099 |
| 55 to 64 years | 84,259 | 84,913 | 85,556 | 85,686 | 85,717 |
| 65 years and over | 92,894 | 96,218 | 100,186 | 104,064 | 108,017 |
| Percentage of 65+ | 17.6% | 18.2% | 18.9% | 19.7% | 20.5% |
| Median age | 44.7 | 45.2 | 45.6 | 46 | 46.5 |
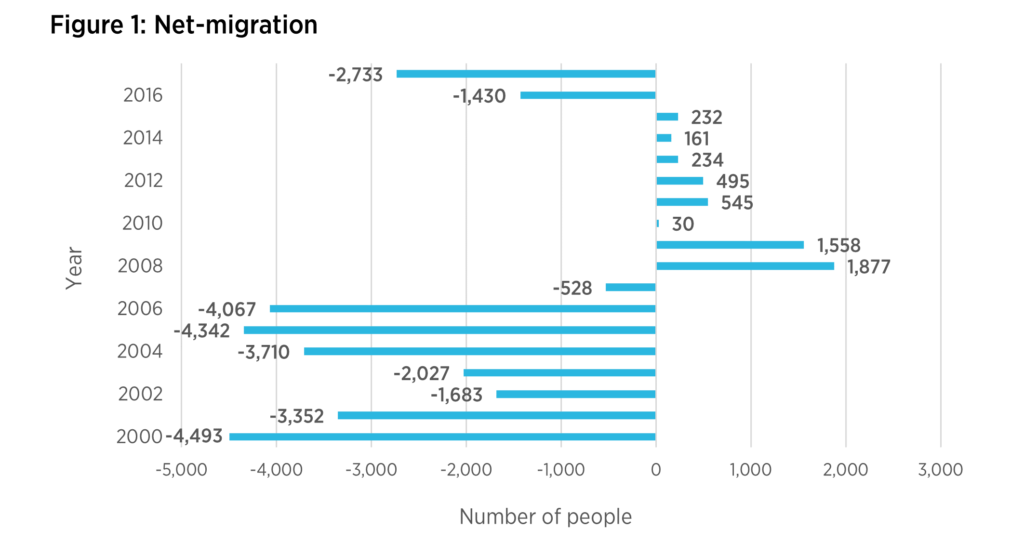
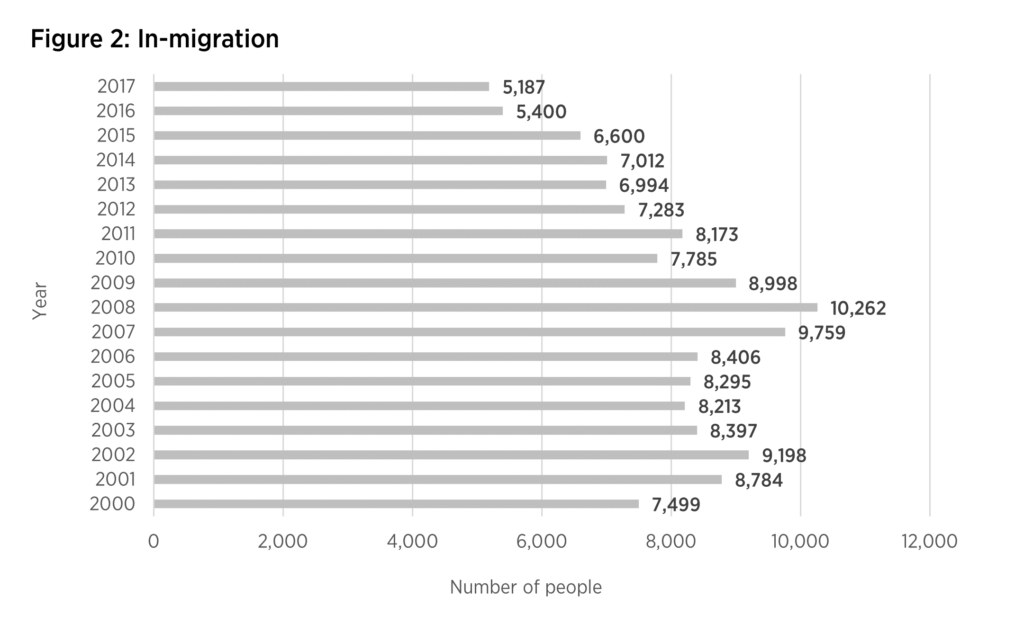
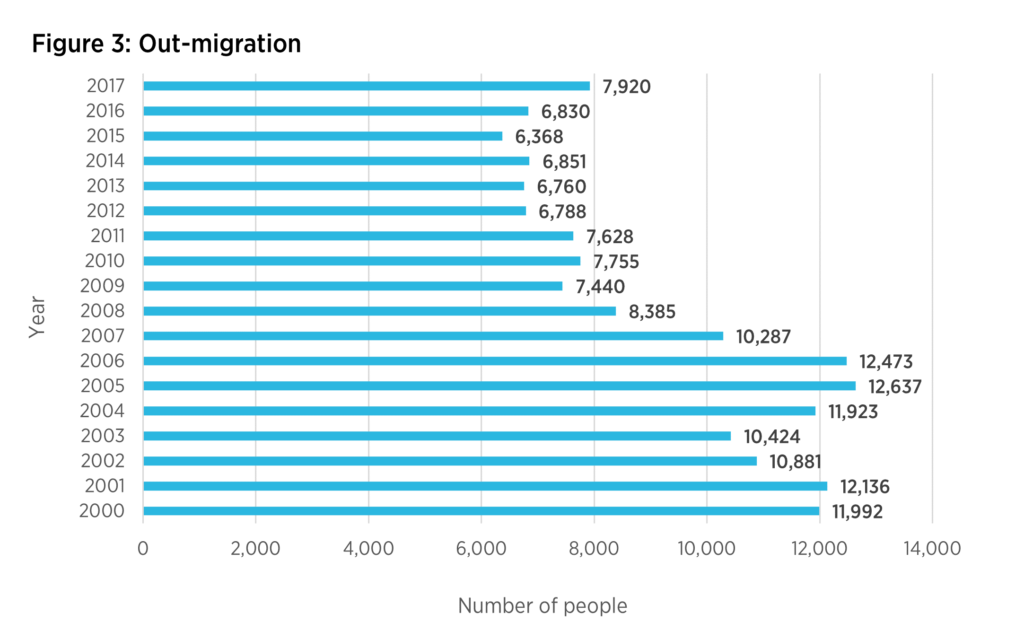
Figures 1, 2 and 3 below show that net interprovincial out-migration is a defining trend for NL since 2000, as younger workers are leaving to go to other provinces to pursue employment and educational opportunities (ACOA, 2019).
Economic Growth
Even as NL’s demographics threaten to shrink the labour pool, the demand for workers has steadily increased. This can be attributed to economic recovery which can come from robust natural resource development, more capital investment (for example the West White Rose and Voisey’s Bay projects) and the growth of the tourism, international education and high-tech industries. Table 3 shows that after an economic contraction due to the collapse of oil prices, the NL economy has recovered since 2017, creating more employment. This growth was accompanied by a tightening labour market due to retirement and out-migration, with NL’s labour force participation rate being approximately 7 percent lower compared to the rest of Canada (Table 3). According to a Canadian Federation of Independent Business report, there were 2,400 unfilled jobs in NL in 2018 (CFIB, 2018).
Table 3. Selected Economic Indicators, Newfoundland and Labrador (NL government, 2018)
| Indicator | 2014 | 2015 | 2016 | 2017 | 2018 | 2019f | 2020f |
| GDP ($M) | 34,277 | 31,138 | 31,696 | 33,074 | 34,362 | 35,242 | 35,082 |
| Change, real (%) | ‐1.2 | ‐1.2 | 1.8 | 0.9 | -2.9 | 4.1 | 0.2 |
| Investment, Gross Fixed Capital Formation ($m) | 12,035 | 12,087 | 13,873 | 10,978 | 9,684 | 11,313 | 9,250 |
| Change in investment, real (%) | 2.0 | ‐1.8 | 8.8 | -18.0 | -12.9 | 14.4 | -19.7 |
| Labour force (in thousands of workers) | 270.9 | 270.8 | 268.7 | 262.9 | 261.4 | 262.3 | 260.3 |
| Change in labour force, real (%) | -1.3 | 0.0 | -0.8 | -2.2 | -0.6 | 0.3 | -0.8 |
| Employment (in thousands of workers) | 238.6 | 236.2 | 232.6 | 224.1 | 225.3 | 228.1 | 225.2 |
| Change in employment, real (%) | -1.7 | -1.0 | -1.5 | -3.7 | 0.5 | 1.2 | -1.3 |
| Unemployment rate (%) | 11.9 | 12.8 | 13.4 | 14.8 | 13.8 | 13.1 | 13.5 |
| Participation rate (%) | 61.0 | 61.1 | 60.5 | 59.0 | 58.9 | 59.2 | 58.8 |
While there has been a decline in labour force participation, the unemployment rate remained stable and GDP has been growing at a slow rate. Normally labour force participation increases with economic growth. This deviation may suggest that NL’s economy is in a transition from a resources-based economy to a knowledge-based economy (Government of Newfoundland and Labrador, 2019a), and some employees are exiting the labour market due to the lack of suitable skills to find a job in the new economy.
Tables 4 and 5 show that oil related industries employed fewer people in the economy and contributed less to provincial GDP between 2013 and 2017. Meanwhile the contribution of the service industries to GDP and employment have gradually increased or remained relatively stable over time.
Table 4. Percentage of GDP by Industry, Newfoundland and Labrador (NL Government, 2019b)
| Industry | 2013 | 2014 | 2015 | 2016 | 2017 |
| Oil Extraction & Support Activities for Oil and Mining | 28.2% | 28.4% | 25.7% | 15.1% | 14.4% |
| Finance, Insurance, Real Estate & Business Support Services | 12.3% | 12.6% | 13.0% | 15.6% | 14.7% |
| Professional, Scientific & Technical Services | 2.6% | 2.3% | 2.4% | 2.6% | 3.1% |
| Education Service | 4.9% | 4.9% | 4.9% | 5.8% | 5.7% |
| Information, Culture & Recreation | 2.3% | 2.4% | 2.5% | 2.8% | 2.7% |
| Public Administration | 6.5% | 6.9% | 6.9% | 7.8% | 7.5% |
Table 5. Employment of people by industry (in thousands, and as a percentage of total NL population), Newfoundland and Labrador (NL Government, 2019b)
| Industry | 2013 | 2014 | 2015 | 2016 | 2017 | 2018 |
| Oil Extraction & Support Activities for Oil and Mining | 8.8 (3.8%) | 9.2
(3.9%) |
8.4
(3.6%) |
7
(3%) |
5.3
(2.3%) |
5.2
(2.3%) |
| Finance, Insurance, Real Estate & Business Support Services | 15.1 (6.5%) | 15
(6.3%) |
15.5
(6.6%) |
14.8
(6.4%) |
13.3
(5.9%) |
13.8
(6.1%) |
| Professional, Scientific & Technical Services | 9.2 4.0% | 10.6
(4.4%) |
11.3
(4.8%) |
10.5
(4.5%) |
9.8
(4.4%) |
10.0
(4.4%) |
| Education Service | 18.1 (7.8%) | 17.6
(7.4%) |
15.1
(6.4%) |
14.3
(6.1%) |
15.2
(6.8%) |
15.9
(7.1%) |
| Information, Culture & Recreation | 6.6 (2.8%) | 7.5
(3.1%) |
7.3
(3.1%) |
7.1
(3.1%) |
6.5
(2.9%) |
7.2
(3.2%) |
| Public Administration | 18.3
(7.9%) |
17.5
(7.3%) |
15.7
(6.6%) |
15.3
(6.6%) |
15.1
(6.7%) |
16.8
(7.5%) |
This trend is in line with the provincial economic growth strategy to diversify NL’s economic output while maintaining the strength of existing core industries (Government of Newfoundland and Labrador, 2019a), while increasing the capacity in service sectors such as information and communications technology (ICT) and international education.
Technology & Skills
Technology changes the nature of work and skills needed at work. This can lead to less labour force demand in some fields, and a shortage of skilled workers in other fields, as well as potential skill gaps. Some jobs require new skills and some new jobs are created in response to technology. An employer survey by the World Economic Forum shows that at least half of all employees will require significant re-skilling or up-skilling to be able to work with changing technology (World Economic Forum, 2018).
In NL, the highest number of job openings will be in technical occupations (ACOA, 2019). Occupations with at least a college diploma in public administration, education services, professional, scientific and technical services are among the top ten industries seeking employees across NL. About 14 percent of job ads require at least a university degree or higher education credentials. (The Job Vacancy Report 2017, Government of NL). However, only 4.6 percent of unemployed Newfoundlanders held a university degree or higher education degrees in 2017 (Statistics Canada, 2017). According to the 2016 Census, 49.1 percent of people aged 25-64 years old had a college diploma (Statistic Canada, 2016). Therefore, unemployment is more likely to be structural due to contrasting skills.
A report on occupational ratings (Table 6, Department of Finance, Fall 2018) shows the kind of occupations likely to be in demand in the upcoming years, broken out by educational and training requirements. They include natural resources industries with occupations such as processing, manufacturing and machine operating, which will likely continue to need workers. Additionally, occupations in the knowledge-intensive economy, such as highly skilled managers in financial and business services, will also likely be in high demand.
Table 6. Occupational ratings for 2018-2027 for NL (Department of Finance, 2018)
| Occupations that usually require university education | Occupations that usually require college education or apprenticeship training | Occupations that usually require secondary school and/or occupation-specific training | Occupations where on-the-job training is usually provided | |
| Competition for qualified labour will be strong | Managers in health, education, social and community services, sales, natural resources production and fishing | Control operators | ||
| New labour supply will be required to meet anticipated job openings | Managers in all fields
Professionals in business and finance |
Technical occupations
Professionals in business, finance and administration Supervisors in manufacturing and utilities |
Machine operators
Administrative support occupations Tourism and security related occupations |
Labourers in processing, manufacturing and utilities, and some elementary service occupations
Cleaners |
Economic and Immigration Policies
NL is facing more serious structural skill shortages compared to other provinces, even as the economy transitions from resource dependence to greater diversification. To alleviate skills shortages, it is necessary to focus on re-skilling or upskilling the existing labour force as well as developing a new pool of skilled workers. Immigrants, temporary foreign workers, refugees, and international students are part of the solution and immigration policies in NL can facilitate the growth of this new source of skilled workers.
International migration accounts for most population growth in Canada. According to Statistics Canada, population growth through immigration has been twice that of natural increase (Statistics Canada, 2019b). Since the inception of the Temporary Foreign Worker Program and the points system in the 1960s, immigration policies have had a significant effect on mitigating the short- and long-term labour and skill shortages. The Canadian Experience Class was introduced to attract and retain skilled workers and international students who have Canadian work experience or education experience to become permanent residents and alleviate skill shortages. These policies have contributed to the success of Canada’s labour market, economy and social outcomes (IRCC, 2018).
As part of the Government of Canada’s immigrant selection criteria, most newcomers to Canada are economic immigrants chosen by the point system that is based on several factors, including education and age. As a result, the newcomers tend to be more educated than Canadian-born workers (Docquier and Marfouk, 2004; Grogger and Hanson, 2011), and younger (Statistics Canada, 2019a), which means they are more productive and will stay in the workforce longer. In addition, immigrants play an important role in an open economy due to their knowledge of the markets and products of their country of origin (Dunlevy, 2004; 2019).
The most important contributions of immigrants include their innovation and entrepreneurship. Immigrants are fundamentally heterogeneous in terms of their abilities and skills as a result of their different education, cultural backgrounds and working experience, which can be considered important sources of innovation (Hanson 2012; Ozgen et al., 2014) and productivity (Huber et al., 2010; Hou et al., 2018; Harrison, Harrison· & Shaffer, 2019). Due to their relatively higher risk appetite, and lack of employment opportunities that provide decent income, immigrants are also more likely to start their own business, which can in turn create more jobs for the local community. For example, more than half of new Silicon Valley ventures are established by immigrants, and the same is the case for Canada as a whole (Green et al, 2016). Between 2003 and 2013, the average annual net job growth per Canadian firm was higher among immigrant-owned firms than among firms with Canadian-born owners, as was the likelihood of being a high-growth firm (Garnett et al. 2019).
According to the Government of Canada statistics presented in Table 7 the number of immigrants in NL increased significantly from 2007 to 2018 (IRCC, 2019a). Partially thanks to the introduction of the Atlantic Immigration Pilot Program in 2017, more immigrants are now moving to NL as Table 7 shows.
Table 7. Permanent Residents Admitted to NL Annually (IRCC, 2019b)
| Year | 2007 | 2008 | 2009 | 2010 | 2011 | 2012 | 2013 | 2014 | 2015 | 2016 | 2017 | 2018 |
| Total Immigrants Welcomed | 546 | 627 | 606 | 714 | 685 | 732 | 835 | 899 | 1122 | 1118 | 1171 | 1275 |
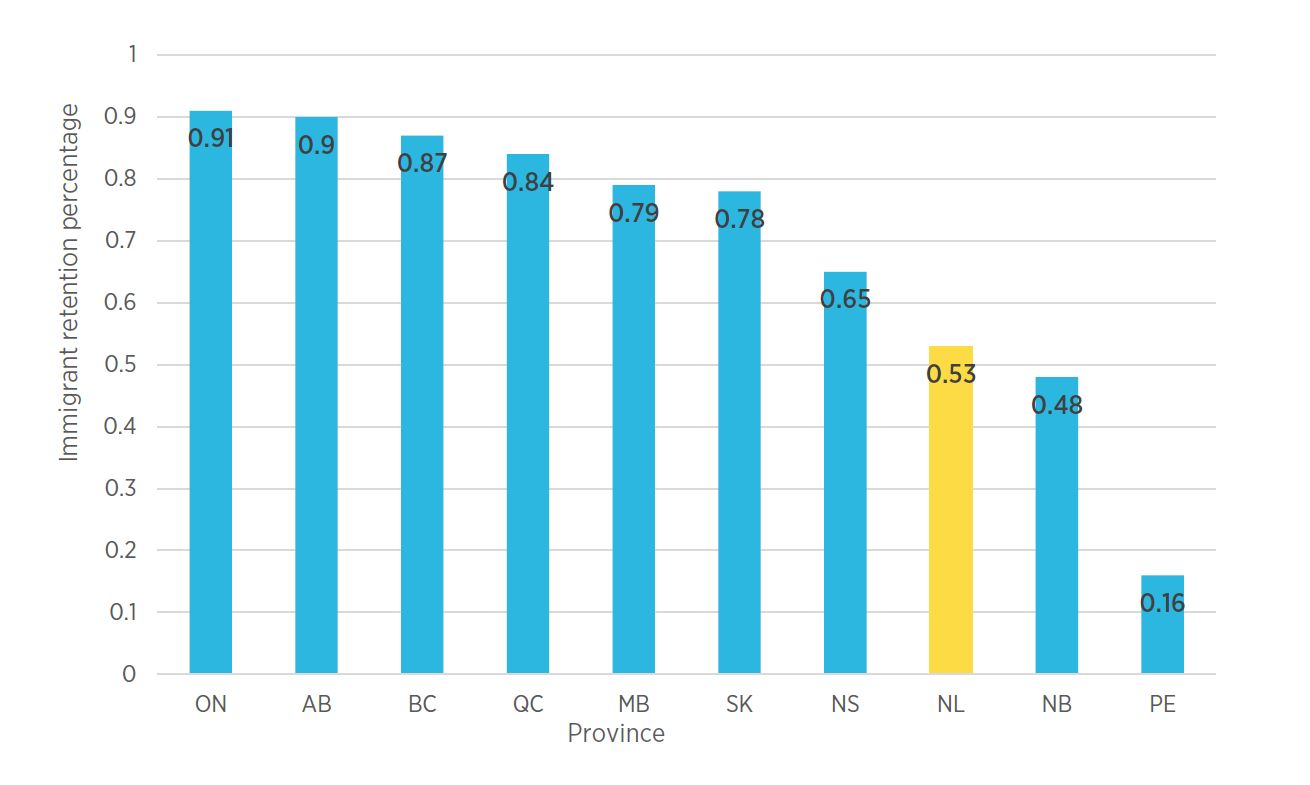
In fact, only 2.4 percent of the total population of NL are immigrants, compared to 21.9 percent for Canada as a whole (Statistic Canada, 2016a). Newfoundland and Labrador attract relatively fewer immigrants and struggle to retain newcomers. As shown in Figure 4, only about half of immigrants stayed in NL five years after admission (Statistics Canada, 2018b).
Figure 4. Five-year Immigrant retention rate, 2011-2015 (Statistics Canada, 2018b)
In 2014, there were 2,261 international students in NL with $48.2 million in annual spending. The presence of these students in turn created 511 jobs (Statistics Canada, 2016b) demonstrating that international students not only increase consumption and create more jobs, but also fill labour skill shortages as new skilled workers (CBIA, 2018a). Currently, there are about 2,800 college level international students enrolled at Memorial University and the College of North Atlantic. By developing an appropriate international education policy and attracting more international students, the economy of the province can grow even further (Government of Newfoundland and Labrador, 2019a). However, the number of international students in NL represent only 1 percent of the total students in Canada, while British Columbia attracted 24 percent and Ontario attracted 48 percent respectively in 2017 (CBIE, 2018b). Even though the retention rate of international students rose to about 17% in NL between 2004 and 2015 (Toughill, 2018), it is still low compared to Ontario and Quebec, which retain over 70 percent of international students (Smith, 2016).
Canadian employers often hire temporary foreign workers to fill immediate skills and labour shortages on a temporary basis. Including positions that Canadian citizens and permanent residents are not available or willing to fill, such as seasonal work (Curry, 2016), highly skilled occupations in technology, and low skilled occupations in the service sector (Lemieux and Nadeau, 2015).
In 2017, 78,788 temporary foreign workers were admitted in Canada, including caregivers, agricultural workers and other workers who require a Labour Market Impact Assessment (LMIA). In addition, 224,033 work permits were issued under the International Mobility Program (IMP), which are exempt from an LMIA due to agreements that promote economic, social, and cultural exchange between Canada and other countries (Hussen, 2018). Temporary foreign workers can transition to permanent residence status through the Canadian Experience Class, Provincial Nominee Programs and the Express Entry Program (Prokopenko & Hou, 2018). There is a growing number of temporary foreign workers who obtain permanent residence and most of them are highly skilled workers (Prokopenko & Hou, 2018). In the past the Canadian Federation of Independent Business emphasized the demand by employers for temporary foreign workers in NL by explaining that,
“There are times we cannot find people regardless of what we do. We can raise wages, offer benefits, do what is necessary and members are still not getting the applicants required (across the country)”
(The Telegram, 2014).
More recently, an employer survey and study on the hiring of temporary foreign workers also showed the need for these workers in NL due to the difficulties in attracting workers at all levels (Fang et al, 2017).
Stakeholder Perspectives on Hiring and Retaining Skilled Workers
Various organizations including government agencies, businesses, and academic institutions have raised concerns about labour and skill shortages in NL. Employers have a crucial role; the experiences and opinions of the private sector are a strong reference for decision making to address skill gaps and challenges across NL.
In May 2019, PPF organized consultations with employers at the St. John’s Board of Trade to engage employers from different sectors including energy, information technology, education, tourism, and business services to discuss pressing topics such as:
- The kind of skills shortages that employers are facing;
- The challenges impacting employers’ decisions in hiring newcomers;
- Examples of successful policies or practices that can help overcome these challenges; and
- Suggestions to governments, communities, and businesses to overcome skill shortages and improve the employment and retention of newcomers.
Through discussion, the consultation was intended to:
- Identify sectors that experience labour and skill shortages;
- Examine factors influencing employers’ decisions to hire skilled immigrants, refugees, international students and temporary foreign workers;
- Identify factors that positively or negatively impact employers’ decisions to hire newcomers;
- Identify practices from government and other stakeholders that can help employers’ recruitment of newcomers; and
- Identify measures to increase the skilled immigrant retention rate in the province.
Table 8 summarizes the input of employers through their experience with labour and skill shortages and their recommended solutions to address these shortages.
Table 8. Summary Findings from Employer Consultation in St. John’s
| Sector | Skill shortages | Challenges | Potential solutions |
| Engineering and energy |
|
|
|
| Education, government and services |
|
|
|
| Sector | Skill shortages | Challenges | Potential solutions |
| Business |
|
|
|
| Information and communications technology |
|
|
|
Newfoundland and Labrador faces a shortage of skilled workers, especially in areas such as computer engineering, information technology, sustainable food safety, healthcare, social work, and bilingual services. This situation is particularly acute in rural communities.
NL has found it difficult to attract people from other provinces because of a perceived unstable economic situation and high unemployment rate. Similarly, it is difficult to attract immigrant workers because the immigration process and regulations are considered long and tedious, which discourages employers from hiring newcomers. Employers are also hesitant to hire immigrants out of concern that they may not fit culturally, that they will not have adequate language skills, they aren’t well trained, and/or that they will leave soon after arriving. Many employers, particularly in information technology, are contracting business out, and some have moved their business to other provinces where it is easier to find and hire skilled workers.
Sector representatives and employers consulted in St. John’s made the following key recommendations:
- Develop a one-stop database and information platform to collect and provide information on labour market, policies and services. This will enable employers to easily obtain information about services and processes when hiring immigrants, temporary foreign workers and international students. It will also help newcomers learn about career opportunities, what kind of skills are needed in the province, and what kind of support is available to them.
- Involve the private sector in the immigration policy-making process by ensuring that immigration programs and processes are informed by employers and entrepreneurs who understand the process of hiring and are striving to retain talented workers.
- Continue to evaluate and improve the Atlantic Immigration Pilot Program to make the process easier, faster and more transparent. This includes streamlining the immigration process and providing adequate information to eliminate inconsistencies and delays.
- Ensure adequate immigration legal services for employers, international students and temporary foreign workers during the immigration and employment process.
- Develop business and education sector partnerships by offering joint training programs for immigrants and international students in order to build practical workplace skills including technical skills, interpersonal skills, and bilingual language skills relevant to the local business culture.
- Build close connections between employers, immigrants and international students by organizing networking events and other support services.
- Develop collaboration between educational institutions and immigrant settlement agencies to integrate different language training resources across NL and provide language training information to immigrants, temporary foreign workers and international students more effectively and efficiently.
- Improve transportation infrastructure and access to convenient and affordable public transportation systems to meet the daily commuting needs of the public.
- Build wider communication channels among local communities and improve stakeholder collaboration to disseminate information about the valuable contributions made by immigrants to NL’s economy and society.
In conclusion, NL face deep structural labour and skill shortages which will affect long-term economic development and prosperity. Residents of the province need to know that the economy of the province can be improved by better attracting and integrating newcomers. Immigrants, international students, and refugees arriving in NL need to know about skill and labour shortages in different industries and the opportunities that exist for them. Finally, settlement agencies need to work with the government, employers, and training institutions to ensure the smooth settlement and integration of newcomers to the province.
References
Atlantic Canada Opportunity Agency (ACOA). (2019). An exportation of skills and labour shortage in Atlantic Canada.
Belec, B. (2014). Lobby continues to lift foreign labour ban. The Telegram.
Canadian Bureau for International Education. (2018a). Retaining International Students in Canada Post-Graduation: Understanding the Motivations and Drivers of the Decision to Stay.
Canadian Bureau for International Education. (2018b). International Students in Canada, 2018.
Citizenship and Immigration Canada (CIC). (2016). Annual report of parliament immigration.
Curry, B. (2016). Ottawa allows seasonal exceptions to temporary foreign worker rules. Globe and Mail.
Docquier, F., and Marfouk, A. (2004). Measuring the international mobility of skilled workers (1990–2000): release 1.0. The World Bank.
Docquier, F., Ozden, Ç., and Peri, G. (2013). The labour market effects of immigration and emigration in OECD countries. The Economic Journal, 124(579), pp. 1106-1145.
Dunlevy, J.A. (2004). Interpersonal networks in international trade: Evidence on the role of immigrants in promoting exports from the American states. Working article. Miami University.
Employment and Social Development Canada (ESDC). (2007a). Archived – Temporary Foreign Worker Program improved for employers in B.C. and Alberta.
Employment and Social Development Canada (ESDC). (2007b). Archived – Canada’s new government makes improvements to the Temporary Foreign Worker Program.
Employment and Social Development Canada (ESDC). (2008). Archived – Government of Canada announces expansion of Temporary Foreign Worker Program Pilot Project to ease labour shortages for employers in B.C. and Alberta.
Fang, T. (2009). Workplace responses to vacancies and skill shortages in Canada. International Journal of Manpower, 30(4), pp. 326-348.
Fang, T., Sapeha, H., Williams, G., Neil. K., Jaunty-Aidamenbor, O. and Osmond Y. (2017). The Temporary Foreign Worker Program and empployers in Labrador.
Garnett, P. and Rollin, A-M. (2019). Immigrant entrepreneurs as job creator: The case of Canadian private incorporated companies.
Government of Newfoundland and Labrador. (2017). Job Vacancy Report 2017.
Government of Newfoundland and Labrador, Department of Finance. (2018). Occupational ratings.
Government of Newfoundland and Labrador. (2019a). Economic Growth Strategy for Newfoundland and Labrador.
Government of Newfoundland and Labrador. (2019b). Selected economic indicators, Newfoundland and Labrador.
Green, D., H. Liu, Y. Ostrovsky, and G. Picot. (2016). Immigration, business ownership and employment in Canada. Analytical Studies Branch Research Paper Series, 375. Statistics Canada Catalogue no. 11F0019M. Ottawa: Statistics Canada.
Grogger, J., & Hanson, G. H. (2011). Income maximization and the selection and sorting of international migrants. Journal of Development Economics, 95(1), pp 42-57.
Hanson, G. (2012). Immigration, productivity, and competitiveness in American industry, pp. 95-129. In Hasset, K. (Ed.) Rethinking Competitiveness. Washington D.C.: The AEI Press.
Harrison, D. A., Harrison, T., and Shaffer, M. A. (2019). Strangers in strained lands: Learning from workplace experiences of immigrant employees. Journal of Management, 45(2), pp. 600–619.
Huber, P., Landesmann, M., Robinson, C. and Stehrer, R. (2010). Migrants’ skills and productivity: A European Perspective. National Institute Economic Review, 213, pp. 20–34.
Immigration, Refugees and Citizenship Canada (2018). 2018 Annual report to Parliament on immigration.
Kareem, E-A. and Goucher, S. (2017). Immigration to Atlantic Canada: Toward a prosperous future.
Kim, C.U., Lim, G. (2011). The role of human capital in networks effects: Evidence from US exports. Global Economic Review, 40(3), pp. 299–313.
Kim, C.-U., and Lim, G. (2016). Immigration and international trade: Evidence from recent South Korean experiences. International Area Studies Review, 19(2), pp. 165–176.
Kunin, R. and Associates, Inc. (2016). Economic impact of international education in Canada – 2016 Update.
Lemieux, T., and Nadeau, J-F. (2015). Temporary Foreign Workers in Canada: A look at regions and occupational skill. Report by the Office of the Parliamentary Budget Officer (PBO).
Manpower Group. (2018). Solving the talent shortage: Build, buy, borrow and bridge. 2018 Talent shortage Survey.
Michel, B., Romain, N. and Lionel, R. (2014). Determinants of the international mobility of students. Economics of Education Review, 41, pp. 40–54.
Narrative Research. (2019). Perception of immigration. Narrative research’s Atlantic Quarterly Immigration Results, 2019.
Ostrovsky, Y., G. Picot, and Leung, D. 2018. The financing of immigrant-owned firms in Canada. Small Business Economics.
Ozgen, C., Nijkamp, P., and Poot, J. (2013). The impact of cultural diversity on firm innovation: Evidence from Dutch micro-data. IZA Journal of Migration, 2(1), pp. 18.
Toope, P. (2013). The role of immigration in the Newfoundland and Labrador labour market: A case for increasing attraction and retention. The Newfoundland and Labrador Business Coalition.
Prokopenko, E. and Hou, F. (2018). How temporary were Canada’s Temporary Foreign Workers?
Rosenzweig, M., Irwin, D., and Williamson, J. (2006). Global wage differences and international student flows [with comments and discussion]. Brookings Trade Forum, pp. 7-96.
Skills Canada B.C. (2004). Skill shortages in B.C. Ministry of Skills Development and Labour, Government of British Columbia.
Smith, W. (2016). New data and research at Statistics Canada for evidence-based decision-making. Panel discussion, September 13, 2016. St. John’s, NL.
Statistics Canada. (2016a). Focus on geography series, 2016 Census.
Statistics Canada. (2016b). Education highlight tables, 2016 Census.
Statistics Canada. (2017). Labour force characteristics by educational degree, monthly, unadjusted for seasonality.
Statistics Canada. (2018a). Estimates of the components of interprovincial immigration, by age and sex, annual.
Statistics Canada. (2018b). Retention rate five years after admission for immigrant tax filers admitted in 2011, by province of admission.
Statistics Canada. (2019a). Population estimates on July 1, by age and sex.
Statistics Canada. (2019b). Annual demographic estimates: Canada, provinces and territories, 2018 (Total Population only). https://www150.statcan.gc.ca/n1/pub/91-215-x/2018001/sec1-eng.htm
Statistics Canada. (2019b). Temporary residents: Temporary Foreign Worker Program (TFWP) and International Mobility Program (IMP) Work Permit holders – Monthly IRCC Updates.
Toughill, K. (2018). Success! International students more likely to stay. Atlantic Canada Polestar News.
This Project is Funded By

Thank you to our Event partners
This report is part of PPF’s Immigration & Atlantic Revitalization project that is examining immigrant retention and skilled labour shortages across Atlantic Canada.


